Montana’s farmland values continue moderate downward trend in latest USDA estimates
November 22, 2021
By Dan Bigelow
In August, the U.S. Department of Agriculture’s National Agricultural Statistics Service
(NASS) released their annual farmland value estimates for 2021. The NASS estimates are derived from a survey, administered each June, in which farm operators are asked to estimate the market
value of their land. For states with property transaction price non-disclosure rules,
such as Montana, the NASS estimates represent one of the only publicly available sources
of farmland value estimates.
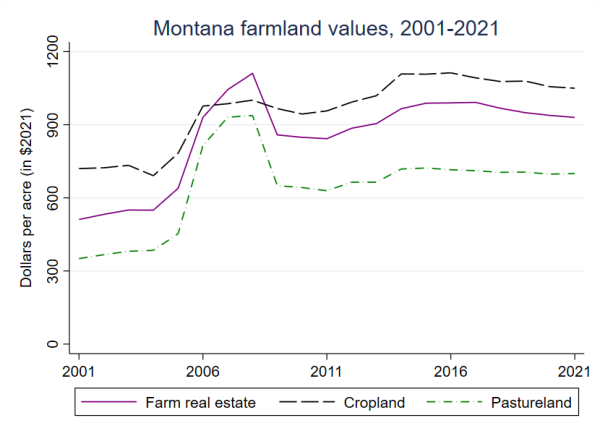
Per the latest survey, after adjusting for inflation using the Federal Reserve’s GDP
implicit price deflator, the values of cropland ($1,050/acre) and total farm real
estate ($930/acre; all farmland and farm-related buildings) exhibited year-on-year
declines of 1%. The declines for cropland were similar in relative magnitude, at roughly
1%, for both nonirrigated ($835/acre) and irrigated ($3,050/acre) land. Pastureland
value ($700/acre), in contrast, increased over the past year, albeit slightly (< 1%).
In part, these changes reflect the high rate of inflation that has overtaken the US
economy since 2020, which pushes up the real value of farmland from previous years.
In fact, in nominal terms (i.e., without the inflation adjustment), cropland and farm
real estate values actually increased by 2% over the past year, while pastureland
value increased by 3%.

Cash rents showed inflation-adjusted gains between 2020 and 2021, increasing by 3%
for cropland (to $36/acre) and 5% for pastureland ($7.20/acre). Renting land tends
to be less common in Montana compared to other states, but cash rents are generally
thought to be a reasonable proxy for net operating income. By taking the ratio of
cash rent to land value, we arrive at the simplest version of the farmland capitalization
rate (or “cap rate”), which measures the fraction of the land’s purchase price covered
by annual proceeds from renting out the land. For example, a cap rate of 5, implies
that the purchase price of the land will be fully paid for through rental income after
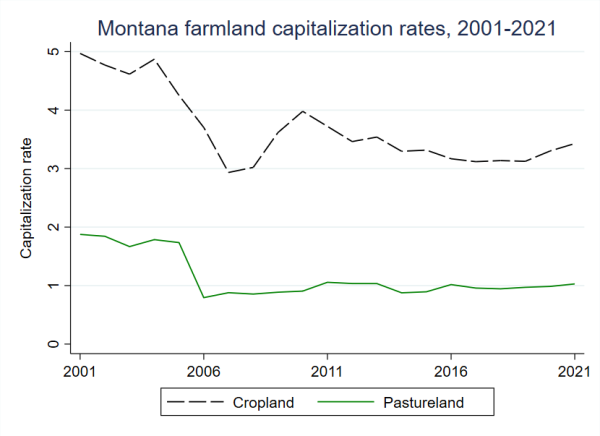
about 20 years (since 100/5 = 20). As shown in the second figure, the combination
of recent land value and cash rent changes has put upward pressure on the cap rate
for both cropland and pastureland. At a current level of 3.43%, the cropland cap rate
is at its highest level since 2013. The pastureland cap rate, at 1.03%, is also at
its highest level since 2013.

In terms of where farmland values may be headed, one major thing to keep an eye on
over the coming year is what happens to interest rates, which are inversely related
to the value of long-held assets, such as land. The recent persistence of low interest
rates is thought to have been a major driver of stubbornly high farmland values over the past several years. If economy-wide inflation continues to run high, the
Federal Reserve may need to revise their target benchmark interest rate target upward, which would eventually put downward pressure on farmland values.


