
Interpretation of Soil Test Reports for Agriculture
Agriculture and Natural Resources
MT200702AG
Revised November 2023

By Courtney Pariera Dinkins, Research Associate, and Clain Jones, MSU Extension Soil Fertility Specialist and Professor, Department of Land Resources and Environmental Sciences
The purpose of this guide is to provide producers, Extension agents and crop advisers with the tools to better understand and interpret soil test reports. Data in soil reports is used to determine fertilizer rates and any need for soil amendments, thereby improving crop yield, profit, and soil health. In addition, data are only worthwhile if the tested soil sample accurately represents the sampled field. Therefore, a summary of sampling methods is provided.
Soil Sampling
To obtain meaningful and accurate soil test results, it is important to collect soil samples from the correct depth and from multiple locations within a field. Plan soil sampling to allow adequate time for soil analysis and fertilizer purchase prior to application. A minimum of six samples, and ideally 10, should be collected and composited (mixed) from each field.
Soil samples are typically collected using hand probes, hand augers (Figure 1), spades, shovels or vehicle-mounted hydraulic probes or augers (Figure 2). Unless they are the only option, avoid shovels and spades because they are not designed to obtain the same amount of soil from each depth and location, possibly biasing results. Hand augers are especially useful when sampling at different depths. Many Extension offices have hand probes or augers and may either lend out the tools or assist in soil sampling. Tools should be cleaned between fields and stored away from fertilizers to prevent contamination.
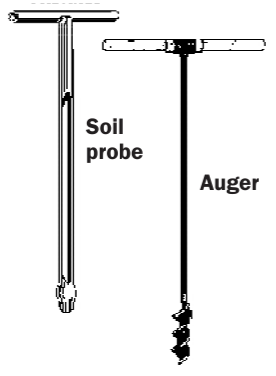
Figure 1. Soil sampling hand probe and auger.
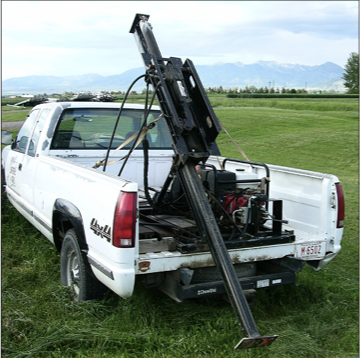
Figure 2. Soil sampling vehicle mounted hydraulic probe.
SAMPLING DEPTH
Soil samples are generally collected 0-6 inches and 6-24 inches from the soil surface. The lower depth is analyzed for nitrate ‘as nitrogen’ (nitrate-N), and sometimes for sulfate-sulfur (sulfate-S) and chloride (Cl), because these three nutrients are very soluble and can move in the soil more readily than other nutrients. Because high levels of nitrate-N may accumulate at deeper depths, especially in fallow systems, and because many crops root below two feet, nitrate-N is sometimes sampled below two feet. Unlike fallow systems, there is generally very little N below two feet in continuously cropped systems.
If low pH is suspected (see pH section below), sample the top 3 inches to measure soil pH in areas that show symptoms of low pH, and compare those pH values with values from healthy areas. Handheld pH meters are available that provide quick, reliable results in the field.
SAMPLING TIME
Ideally, soil sampling occurs yearly in the spring to best estimate growing season nutrient availability; however, due to time constraints and soil conditions, it may be more practical to sample soil in the fall or winter. Sampling in the fall does not always capture the true amount of N that will be available at spring seeding because some N is released from soil organic matter (SOM) during the winter months in a process called “mineralization,” or conversely, N in a very wet year, can be leached. Fall nitrate-N levels will be similar to spring nitrate-N levels if the fall and winter are cold and dry, because these conditions essentially stop N mineralization and leaching. Coarse or shallow soils (less than two feet) tend to have larger changes in nitrate levels over winter and should be sampled in the spring (Jones et al. 2011). Most importantly, submitted samples should be mixed from at least six samples within the field, and the soils should be kept frozen or dried immediately and quickly after sampling to prevent changes in nitrate concentrations. Please contact your local Extension agent for specific information on soil sampling plans and recommended methods to prepare samples for soil testing or refer to the three soil testing Soil Scoops available at: landresources.montana.edu/soilfertility/ soilscoop/index.html. Resources mentioned here are listed under “For more information” at the end of this bulletin.
SOIL TESTING LABORATORIES
Fertilizer recommendations are only as good as the accuracy of the soil tests on which they are based. A fairly high degree of variability has been observed among testing laboratories. The time spent selecting a good laboratory can quickly pay for itself in the form of accurate fertilizer recommendations, desired crop responses and better economic returns. Laboratories that are part of the North American Proficiency Testing Program (NAPT) or the Agricultural Laboratory Proficiency Program (ALP) can provide you with results from their analysis of standardized soil samples with known nutrient levels. Laboratory analyses have a level of uncertainty based on test methods used and lab proficiency. Unfortunately, studies to date are inconclusive on which soil nutrients or characteristics are consistently reliable and which are less reliable and should be interpreted more broadly (Jacobsen et al. 2002; Miller 2013). It is recommended that soil samples be sent to the same laboratory each year to ensure greater consistency.
The MSU Soil Fertility Extension Soil Sampling website (landresources.montana.edu/soilfertility/soil-samplingmethods.html) lists regional soil testing labs and more information about tests used for soil analysis.
Tissue Sampling
In Montana, crop tissue sampled periodically during the growing season and tested for nutrient deficiencies has often led to inconsistent results, due to inconsistent tissue sampling, handling, preparation and shipping (Jackson, pers. comm.). Because it can take a couple of weeks between sending tissue samples, receiving test results and purchasing/applying fertilizer, yield losses may have already resulted by the time fertilizer is applied. Therefore, it is recommended to identify potential nutrient deficiencies by soil testing prior to the growing season. If you do decide to tissue test, please contact your local Extension agent for specific information on tissue sampling and sample preparation. The following are general guidelines only.
Although the specific plant part to be collected is plantspecific, the general recommendation is to collect recently mature leaves just below the new growth from at least 10 plants. Check with the laboratory to determine how many leaves they need for their analysis. Samples should be free of soil, fertilizer, dust and any other potential contaminants. A dry brush works best and the samples may be wiped with a cloth dampened with distilled water. Do not wash samples under running water for risk of potential nutrient leaching. Samples should be air-dried in a shaded area and placed in a clean paper bag or envelope for delivery to a laboratory. Samples should not be placed in a metal container due to risk of contamination. If a nutrient deficiency is suspected, tissue sampling should occur when the symptoms first appear. Tissue samples from plants with deficiency symptoms should be collected along with samples from healthy plants for comparison. Although sufficiency ranges can likely be found on the Internet or in textbooks to compare with your tissue test results, these values have been determined for other regions, and not for Montana. T herefore, comparing your nutrient levels with healthy plants is likely the best comparison.
Again, tissue analysis should only be used to supplement a routine soil test done prior to the growing season. Tissue testing determines the availability of nutrients prior to the time that the test was taken; it is not a good estimate of current fertilizer needs. Visual assessment for in-season deficiency may also be useful; however, once nutrient deficiency symptoms appear, yield has likely already been hurt. See Nutrient Management Module 9 for more information on visual assessment. The remainder of this guide focuses on soil testing.
Yield Goals
Nitrogen fertilizer recommendations are based on yield goals; therefore, yield goals will be requested by your laboratory. Records of yield from previous harvests should be used to determine realistic, but progressive yield goals for each field. Appropriate yield goals for each field should be high enough to take advantage of high production years when they do occur, but not so high as to risk losing nutrients or reducing profits when weather conditions are not favorable. Appropriate yield goals are about five percent higher than the “Olympic” average (the lowest and highest yield are removed before averaging) over the past five years. If no records exist, yields can be roughly estimated by knowing soil available water, growing season precipitation and average yield per inch of water. Refer to Water Productivity of Montana Crops (store. msuextension.org/Products/Water-Productivity-of-MontanaCrops-MT202204AG__MT202204AG.aspx) for assistance in the determination of yield goals.
Soil Test Date Interpretation
Please refer to Figure 3 for a sample soil test report.
| Name: Producer Sample date: April 1, 2007 | ||||
| Lab number: 12345 Your sample number: 1 | ||||
|
Crop to be grown: Spring wheat Previous crop: Fallow |
||||
| Sampling depth: 0 to 24 inches Yield goal: 50 bu/acre | ||||
| Soil test results | Interpretation | Recommendation | ||
| Nitrate-N | 0 - 6 in | 37 lb/acre | ||
| 6 - 24 in | 36 lb/acre | |||
| 0 - 24 in | 73 lb/acre | Medium | 90 lb N/acre | |
| Olsen Phosphorus | 0 – 6 in | 15 ppm | Medium | 20 lb p205/acre |
| Potassium | 0 – 6 in | 192 ppm | Medium | 40 lb k20/acre |
| Sulfate-S | 0 – 6 in | 6 lb/acre | ||
| 6 - 24 in | 54 lb/acre | |||
| 0 - 24 in | 60 lb/acre | High | ------------------ | |
| Boron | 0 – 6 in | 0.5 ppm | Medium | 1lb B/acre |
| Copper | 0 – 6 in | 1.7 ppm | Very High | ------------------ |
| Iron | 0 – 6 in | 47 ppm | Very High | ------------------ |
| Manganese | 0 – 6 in | 10 ppm | Very High | ------------------ |
| Zinc | 0 – 6 in | 1.3 ppm | High | ------------------ |
| Soluble salts | 0 – 6 in | 0.3 | Low | ------------------ |
| Organic matter | 0 – 6 in | 3.4% | Medium | ------------------ |
| Soil pH | 0 – 6 in | 7.7 | Medium/High | ------------------ |
| CEC | 0 – 6 in | 17.8 | Medium | |
| Soil texture | 0 – 6 in | Sandy loam | ||
Figure 3. Sample Soil Test Report and Fertilizer Recommendations.
MACRONUTRIENTS
Macronutrients that may be tested in your soil include N, phosphorus (P), potassium (K), S, calcium (Ca) and magnesium (Mg). Nitrogen, P and K are considered “primary” macronutrients, because they are required in higher quantities than S, Ca and Mg (“secondary” macronutrients), and because plants develop N, P and K deficiencies more often. In general, Ca and Mg are present in quantities well above the necessary levels in Montana soils and will not be discussed further.
Nitrogen. Plant available N includes nitrate (NO3-) and ammonium (NH4 +). Of the two, nitrate is measured much more often in soil tests, because ammonium is quickly converted to nitrate, making ammonium levels relatively low compared to nitrate levels. Generally, in a soil test report, N is reported as NO3-N in lb N/acre. Nitrate can be produced through decomposition of SOM or easily leached below plant roots by rainfall or irrigation; therefore, soil N tests are representative of current N levels and do not necessarily reflect future conditions.
Phosphorus and Potassium. Unlike N, P is highly immobile in the soil, and less plant-available. Based on the results from 4.5 million soil samples collected throughout much of the U.S. and Canada from Fall 2009 to Spring 2010, the Northern Great Plains generally have the lowest soil P levels (Fixen et al. 2010). Most Montana soils are high in calcium which ties up P, making it relatively unavailable to plants. In 2022, the median Olsen P level in soils tested by AGVISE laboratories was 12 ppm, below the 16 ppm critical level (AGVISE Labs, unpublished data).
There are three major soil tests used for available P: the Bray-1 and Mehlich-3 tests for acidic soils, and the Olsen P tests for neutral to alkaline soils. In Montana’s alkaline soils, P should be tested using Olsen P, also known as bicarbonate-P. Olsen P should be analyzed because Fertilizer Guidelines for Montana Crops presents recommendations based on Olsen P. In addition, Olsen P is fairly robust and works at a wide range of pH levels. Bray, however, does not generally work well at pH greater than 7, and Bray P values can’t be accurately converted to Olsen P. Mehlich-3 can be converted to Olsen P by the equation [(Mehlich P/2.05)-14] = Olsen P (Rogers et al. 2019).
Similar to P, most of the K in Montana soils is contained in minerals. Most Montana soils have medium-to-high available K levels due to relatively high amounts of clay and low amounts of leaching. Although Montana soils are generally higher in K than much of North America, 25 percent of Montana soils tested below 200 ppm in 2022 (AGVISE labs, unpub data), suggesting a higher percentage would test below MSU’s 250 ppm critical level. The common soil K extractant is ammonium acetate.
Over the growing season, K is removed from solution and soil exchange sites by crops, so K soil tests will be lower in late summer. Highest K levels will be measured in the spring just after the soil thaws and before plant uptake becomes substantial. Soil should be tested for K in the spring to provide the most accurate estimate of available K for crops that season. Plants can continuously absorb K beyond yield requirements, so it is important to test soil for nutrient availability to reduce profit loss from over-fertilization. Alfalfa is especially prone to excessive uptake of K (“luxury consumption”).
Sulfur. Like P and K, only a small fraction of the total soil S is readily available to plants. Although the other secondary macronutrients are readily abundant in Montana soils, S deficiencies in Montana have been on the rise. Soil testing is not reliable to determine S sufficiency. Visual symptoms along with soil type and location in the landscape can help determine plant S deficiency. Loam or more coarse-textured soils, especially on eroded ridge tops, are more susceptible to S deficiency, particularly after high rainfall. Unfortunately, responses to S fertilizer are much less consistent than for P and K, partly because concentrations of available S below typical sampling depths can be very high due to high levels of gypsum (CaSO4 ·2H2 O) in Montana soils.
MICRONUTRIENTS
Micronutrients include copper (Cu), iron (Fe), manganese (Mn), zinc (Zn), boron (B), Cl, nickel (Ni) and molybdenum (Mo), all of which are naturally present in the soil. In general, Ni and Mo are present in quantities well above the necessary levels in Montana soils. Zinc and Cl have a greater chance of being deficient, especially for crops with high demands for Zn and Cl (Fixen et al. 2010). Because fewer micronutrient deficiencies are observed than macronutrient deficiencies, there has been little work in Montana to determine crop-specific micronutrient needs, yet general levels are shown in Table 1.
SOIL ORGANIC MATTER
A two-percent SOM content is considered normal for Montana soils. Soils that contain greater amounts of SOM will mineralize more N and soils testing lower in SOM will mineralize less N. General guidelines are to reduce fertilizer N recommendations by 20 lb/acre for soils with greater than three percent SOM, and to increase fertilizer N recommendations by 20 lb/acre for soils with less than one percent SOM.
SOIL PH
Soil pH is a measure of acidity or alkalinity. The pH scale ranges from 0-14, with 7 being neutral. Values less than 7 are acidic and values greater than 7 are alkaline. Most crops grow best with a soil pH between 6 (somewhat acidic) and 7.5 (slightly alkaline). In eastern Montana, surface soil pH is typically between 7-8, while western Montana soils tend to be slightly more acidic. Maximum nutrient availability occurs when pH is optimal for the soil nutrient (Table 1). When soil pH is outside of these optimal ranges, nutrients can be less available to plants, potentially resulting in deficiencies.
Liming is an option to increase pH in acidic soils. Decreasing soil pH is challenging. Elemental S can reduce soil pH over time, but it requires 10,000 lb S/ac to lower the soil pH from 8 down to 7.5 in soil with 1.5 percent calcium carbonate (AGVISE Labs, unpublished data). Fertilization with ammonium-based fertilizer is the leading cause of excessive soil acidification in the top 3-inches of soil, leading to yield losses (landresources.montana.edu/soilfertility/acidif/index.html).
Table 1. Soil nutrient classes, toxicity levels and optimal pH. All levels displayed are for soil samples collected in the 0–6 inch soil depth.
| Nutrient | Low levels | Medium levels | Sufficient | Toxicity levels | Optimal pH |
| ----------------------------------------------ppm------------------------------------------------------ | |||||
| Nitrogen (N) | NAb | NAb | NAb | NAc | 6.5 - 8 |
| Phosphorus (P) | < 8 | 8 – 16 | > 16 | NA | 6.5 – 8 |
| Potassium (K) | < 150 | 150 – 250 | > 250 | 800d | 6.5 – 8 |
| Sulfur (S) | NA | NA | NA | NA | 6.5 – 8 |
| Boron (B) | < 0.5 | 0.5 - 1.0 | > 1.0 | 5e | 5 – 7 |
| Chloride (Cl) | NA | NA | NA | NA | 5 – 7 |
| Copper (Cu) | < 0.25 | 0.25 - 0.5 | > 0.5 | NA | 5 – 7 |
| Iron (Fe) | < 2.5 | 2.5 - 5.0 | > 5.0 | NA | 5 – 7 |
| Manganese (Mn) | < 0.5 | 0.5 - 1.0 | > 1.0 | NA | 5 – 7 |
| Zinc (Zn) | < 0.25 | 0.25 - 0.5 | > 0.5 | 60f | 5 – 7 |
a Comparable to critical levels
b Crop and yield goal dependent
c Crop and soil moisture dependent
d Horneck et al. 2019
f D. Neuman, pers. comm
e Westerman 1990
NA – not available
SOLUBLE SALTS
Soluble salts can cause severe water stress and nutritional imbalances in plants. Generally, seedlings are more sensitive than established plants to elevated soluble salt levels. Values higher than 4 mmhos/cm (or ‘dS/m’) may damage plants, though some crops, such as barley, are more tolerant to salts than others. A soluble salt level can quickly change in the soil due to leaching; therefore, consider sampling a few times per year if you think you have a salt problem. Please see Soil and Water Management Module 2 for more information.
CATION EXCHANGE CAPACITY (CEC)
This parameter is only occasionally tested. The cation (positively charged particle) exchange capacity (CEC) is directly affected by soil pH and SOM content. A high CEC is desired and is indicative of a high capacity for the soil to hold cations (e.g. K+, NH4 +, Cu2+, Fe2+, and Mn2+). A CEC above 10 “milliequivalents” per 100 grams (10 meq/100 g) is considered adequate. The producer has almost no control over CEC.
SOIL NUTRIENT LEVELS
Soil test results will typically indicate whether a nutrient level is low, medium (moderate) or high (adequate). These levels are known as “nutrient classes” or categories and some labs may break these classes down further to very low, low, medium, high and very high. The cutoff between a medium and high level is sometimes referred to as a ‘critical level’ and provides a value that indicates when fertilizer should (below critical level) or should not (above critical level) be added.
Classes represent the chance of a yield response to fertilizer applications (Figure 4); at a low soil test level, there is approximately a 75 percent chance of a yield response to fertilizer applications, whereas, at a high soil test level there is approximately a 25 percent chance of a yield response to fertilizer applications. The probability of a yield response to fertilizer in the medium soil test range is estimated to be about 50 percent. To compare the nutrient level to MSU’s established nutrient classes, refer to Table 1. The likelihood of yield increases from fertilization is greatest in soils with low soil nutrient levels. However, because there are so many factors such as moisture that affect nutrient availability and yield, there is not a guarantee of a yield increase. Fertilizing soils with already sufficient nutrient levels will likely not increase yields.
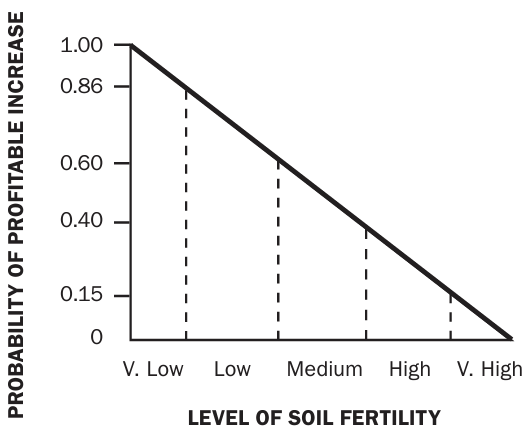
Figure 4. The effect of soil test level on the probability of a profitable yield increase from fertilization.
FERTILIZER RECOMMENDATIONS
Soil test results typically include a fertilizer recommendation. Fertilizer recommendations are based on soil nutrient levels of the previous crop, the crop to be grown and the yield goals (just for N).
Recommended fertilizer rates may need to be adjusted based on climate and soil properties at your specific location due to the high degree of variability throughout the state of Montana and between labs. Out-of-state labs often do not use Montana guidelines. Please contact your local Extension agent or crop adviser for specific recommendations regarding your soil test results. If you want to determine your own fertilizer rates, especially when using an out of state laboratory, please see Developing Fertilizer Recommendations for Agriculture.
The recommended nutrient rates shown on a soil test report are for the actual amount of nutrient, not the amount of fertilizer. To determine fertilizer amounts, you will need to know the fertilizer ‘grade’ (the three numbers on every fertilizer). Grade equates to the percentage of total N, available phosphorus (P2 O5 ) and soluble potassium (K2 O) present. For example, if a fertilizer is labeled 10-50-5, it contains 10 percent N, 50 percent P2 O5 and 5 percent K2 O. If a significant source of a particular nutrient, other than N, P or K, is in the fertilizer, it is typically labeled as a fourth value. This is most often seen with fertilizers containing S (e.g., 21-0-024(S)). See the Calculation Box for an example fertilizer calculation based on a recommended P rate using a fertilizer blend. This sample calculation may also be used to determine the amount of fertilizer to apply to reach a specific N or K recommendation.
CALCULATION BOX
|
Using a fertilizer blend of 10-50-5: Application amount: |
Fertilizer blend applied to meet P recommendations.
Conclusion
By using this guide to help interpret a soil test report, you can gain a better understanding of the soil fertility status of your fields or your producers’ fields. This should provide the foundation to allow you to adjust fertilizer applications to optimize plant growth and fertilizer use. If you want to calculate your own fertilizer rates, please see Developing Fertilizer Recommendations for Agriculture. If you still have questions regarding your soil test report or fertilizer recommendations, please contact your local Extension agent (www.montana.edu/ extension/localoffices.html), Dr. Clain Jones, or a crop adviser.
References
AGVISE Laboratories. Unpublished data. Northwood, North Dakota.
Fixen, P.E., T.W. Bruulsema, T.L. Jensen, R. Mikkelsen, T.S. Murrell, S.B. Phillips, Q. Rund, and W.M. Stewart. 2010. The fertility of North American Soils. Better Crops with Plant Food. 94(4):6-8.
Horneck, D.A., D.M. Sullivan, J.S. Owen, and J.M. Hart. 2019. Soil Test Interpretation Guide. Oregon State University, EC 1478-E, https://extension.oregonstate.edu/catalog/ pub/ec1478
Jackson, G., Retired Professor. Montana State University, Western Triangle Agriculture Research Center, Conrad, Montana
Jacobsen J., S. Lorbeer, B. Schaff and C. Jones. 2002. Variation in soil fertility test results from selected Northern Great Plains laboratories. Communications in Soil Science and Plant Analysis. 33(3&4): 303-319.
Jones, C., C. Chen, J. Eckhoff, M. Greenwood, P. Lamb, A. Lenssen, K. McVay, P. Miller, B. Stougaard, J. Weeding, and M. Westcott. 2011. Changes in Soil Nitrate-N Levels from Late Summer to Early Spring in Montana. Fertilizer Facts No. 55 (landresources.montana.edu/fertilizerfacts/ index.html). Montana State University. 2p.
Miller, R. 2013. Reliability of soil and plant analyses for making nutrient recommendations. Western Nutrient Management Conference. March 7-8, 2013. Reno, Nevada. 10:67-71.
Neuman, D., Previously with Reclamation Research Group, Bozeman, Montana.
Rogers, C., B. Dari, and A. Lytem. 2019. Soil phosphorus testing on alkaline calcareous soils. Crops & Soils 52:36-38. https://acsess.onlinelibrary.wiley.com/doi/pdf/10.2134/ cs2019.52.0510
Westerman, R. (ed.). 1990. Soil Testing and Plant Analysis, 3rd Edition. Soil Science Society of America Book Series No. 3. Soil Science Society of America, Madison, Wisconsin.
Acknowledgements
We would like to extend our utmost appreciation to the following volunteer reviewers of the original version of this document:
Dr. Rick Engel, Retired Professor, Montana State University, Bozeman, MT
Mr. Jeff Farkell, Certified Crop Adviser and Senior Agronomist, Central Ag Consulting, Brady, MT
Dr. Grant Jackson, Retired Professor, Western Triangle Agricultural Research Center, Montana State University, Conrad, MT
Ms. Virginia Knerr, Former Broadwater County Extension Agent, Montana State University, Townsend, MT
Dr. Richard Koenig, Chair, Dept of Crop and Soil Sciences, Washington State University, Pullman, WA
Dr. Kent McVay, Extension Cropping Systems Specialist. Montana State University, Southern Agricultural Research Center, Huntley, MT
Mr. Mark Peterson, Producer. Havre, MT
Kathrin Olson-Rutz, former MSU research associate (2023 revised version)
For more information
See the MSU Extension Soil Fertility website for more materials about soil nutrient management (landresources.montana.edu/ soilfertility/index.html). The following bulletins are available from MSU Extension Communications at 406-994-3273, or online at store.msuextension.org/.
Developing Fertilizer Recommendations for Agriculture (MT200703AG)
Water Productivity of Montana Crops (MT202204AG)
Fertilizer Guidelines for Montana Crops (EB0161)
Nutriet Management Modules
No. 1. Soil Sampling and Laboratory Selection
No. 9. Plant Nutrient Functions and Deficiency and Toxicity Symptoms
Soil and Water Management Modules
No. 2. Salinity and Sodicity Management
landresources.montana.edu/swm/index.html
MSU Soil Fertility Extension Program
Nutrient Deficiency and Toxicity
Cropland Soil Acidification
landresources.montana.edu/soilfertility/acidif/index.html
Soil Sampling
landresources.montana.edu/soilfertility/soil-samplingmethods.html
To download more free online MontGuides or order other publications, visit our online catalog at store.msuextension.org, contact your county or reservation MSU Extension office, or e-mail orderpubs@montana.edu.
Copyright © 2023 MSU Extension
We encourage the use of this document for nonprofit educational purposes. This document
may be reprinted for nonprofit educational purposes if no endorsement of a commercial
product, service or company is stated or implied, and if appropriate credit is given
to the author and MSU Extension. To use these documents in electronic formats, permission
must be sought from the Extension Communications Director, 135 Culbertson Hall, Montana
State University, Bozeman, MT 59717; E-mail: publications@montana.edu
The U.S. Department of Agriculture (USDA), Montana State University and Montana State University Extension prohibit discrimination in all of their programs and activities on the basis of race, color, national origin, gender, religion, age, disability, political beliefs, sexual orientation, and marital and family status. Issued in furtherance of cooperative extension work in agriculture and home economics, acts of May 8 and June 30, 1914, in cooperation with the U.S. Department of Agriculture, Cody Stone, Director of Extension, Montana State University, Bozeman, MT 59717.